The Acumen Fuse benchmarking Tab
Acumen Fuse benchmarking tab is where you can see how your schedule stacks up against others in a given building sector: hospitals, highway, petrochemical, there is ample representation, but a little redundancy as a factor of crossover building sectors.
In other words, Acumen Fuse benchmarking is where bottom-lines are generated in simple, concise terms, and represented in various graphs, histograms, and spreadsheets that can be readily output or published. In theory, it makes plenty of sense, but in practice it is largely contingent on the integrity of Acumen’s analyzers, and formulae.
Acumen Fuse benchmarking generates global ranking scores against similar projects in its Acumen Cloud™ App, under the Fuse Benchmarking tab, and finally, a forecast is projected. Acumen maintains an online repository of this data in the Cloud, which is continually updated with data from actual peer projects, including yours. Note, only one version of each schedule is maintained in Acumen’s Cloud™. After all, Deltek has big infrastructure to back up Fuse, but no data-farms like the NSA has.
The Acumen Fuse benchmarking tab features the twin- engines
- Fuse Schedule Index™
- Fuse Logic Index
Scoring: using Fuse Schedule Index™
The Fuse Schedule Index ™ measures a schedule’s overarching quality, “based upon nine core metrics that all pertain to the overarching quality of a plan. Each of these nine metrics are weighted according to importance to quality.” The metrics are the same ones used in your local analyzers, although Acumen Fuse benchmarking uses industry values.
As stated above, both indices use composite data from the Diagnostics and Logic tabs and metric libraries, and use the Metric Percentile Analyzer (the red- to green slider) to display scores. I like this feature because you can see the results of seven( Index) to nine (Logic) analyzers on one screen, although how each metric is weighted is likely a proprietary formula, thus I can’t decipher it completely.
By the time I reach the Acumen Fuse benchmarking tab, I have already Cleansed, Diagnosed, and optimized logic in my schedule. In other words, I’m already pretty confident that my baselines are already pretty solid. Where it gets interesting, is when a project slips, and updates are run through Fuse. For our purposes, I’ll use examples from just such a project (focus on labels).
Example I
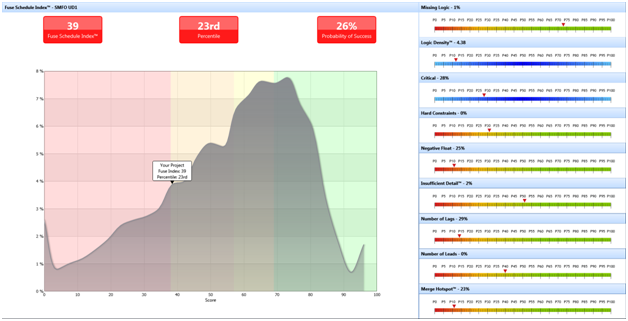
The Schedule Index histogram for te above schedule has a 26% chance of success based on
- Negative float: 25%
- Merge Hotspots: 23%
- Number of lags: 29%
Acumen suggests an index score of >75% as a target. Clearly, this project is challenged.
Rankings: How Does Your Schedule Measure up? Ask the Logic Index.
Acumen says of its Fuse Logic Index
The Fuse Logic Index measures a schedule’s overarching quality. It is a cloud-based metric library that gives insight into the logic quality of a schedule. Logic is viewed as one of the most important underpinnings of a schedule.” It is based on a composite of nine metrics.
Although I count seven, no matter, the Logic Index is more optimistic as to outcome.
Example II
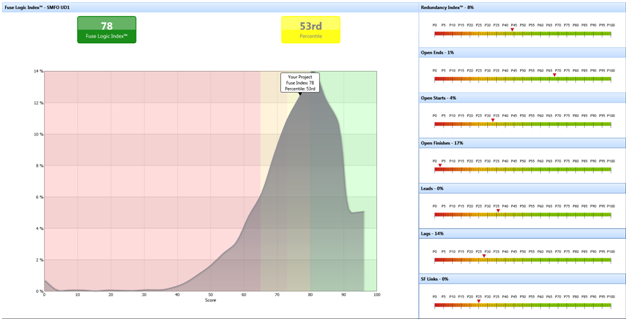
The Logic Index histogram for the above Hospital schedule is in the 53rd percentile. Chiefly due to 17% open-finishes (bar #4) created from ‘dangling activities,’ which I defined in my last post.
Characteristics
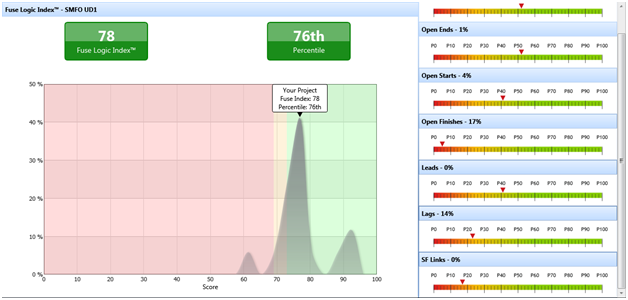
The Characteristics window allows you to scroll down and select your industry from a list, with which Fuse will differentiate thresholds depending on the industry. For example, the above logic index was ‘uncategorized.’ If I scroll to ‘K-12 Education,’ I get a different score-sheet:
Example IV
That’s quite a swing. I note that the manual states that start-to-finish links – predecessor starts when successor finishes, are indicative of a well developed plan, and that the metric is set accordingly. I always thought that the opposite was true. I never use SF links, so I’m a little mystified here.
Summary
So is Benchmarking necessary? I suppose it depends on how much stock you put into Acumen’s analyzers. For example, the default thresholds for the analyzers Logic Density™ and start-to-start relationships are too constrained for the type of schedules I generate. Once I tweak these thresholds in the Metrics tab, I feel more confident in my analyzers; however, Benchmarking uses Acumen’s Cloud database metrics for its data set, not my local criteria. The same analyzers are used, but the weighted values used are different. It’s nice to have a view from several perspectives.


