Acumen Diagnostics is the Big-time for Construction Schedules
I could spend hours perusing the many metric analyzers loaded into Acumen Fuse Diagnostics, where you’ll find a myriad of data-modeling possibilities. Bring your Project Snapshot here, from the Projects window, to start your triage, or just to compare it to another or several versions at once. The multi-version view is a facilitator of the Trend Analysis tool, more of which, further on. Optimally, you will have already Cleansed your schedule, before bringing it to Diagnostics, but you’ll want to note your scores before, and after Cleansing.
The various analyzer tools use a dashboard with a ribbon view, and metric tabs, sorted by phase (FY Qtr), a corresponding timeline, which you can drill down into months, weeks, days, or years, and an activity window, for drilling down. Each of the many analyzers uses their own set of criteria, some of which are Deltek trademarks and others maintained by Federal agencies. Of course, Primavera’s 6 v8.4 Claimdigger churns out much of this data, but it does not analyze. All of Fuse’s phase analysis reports can be exported into impressive multi-tab spreadsheets, for your client to peruse.
Following, is a before (23%) and after (35%), of a schedule that was Cleansed, and subsequently reanalyzed with the Schedule Quality tool, found at the bottom of the Diagnostic window.
Analyzers – Phase and Ribbon: Critical Data Modeling
It’s pretty obvious that the negative-float level is driving the overall score downward, in this Schedule Quality analysis. The % of activities with negative-float was static, but the number of lags was revised. As we tweak the schedule logic more efficiently, the colors change to yellow and green. This score went up to 35% as a benefit of Cleansing away redundant logic; however, it is still challenged with 58% critical activities. The good news is that this is not the baseline schedule (zero-float).
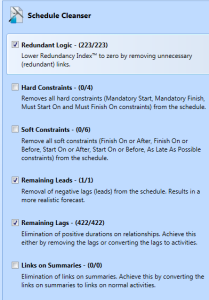
Why did the number of negative-float activities increase, yet the % stayed the same? Because Cleanser added a few-hundred lag activities (lag converted to an activity, as opposed to hidden lag), which do not count as added negative-float activities – only their predecessor.
Here below, are the same two projects analyzed with the DCMA-14 Structure, which uses some of the same metrics, but gives them different weight.
There are many fewer SS/FF relationships (which Fuse rates by density. In this case, most of the deleted SS/FF relationships were from redundancies, yet there are still 9 SF relationships – likely typos (SS). Again, we can drill down into any metric and see all the activities that fit the criteria in the activity window.
The DCMA, GAO, and other metrics are handy because they are used on a regular basis by Federal agencies, to assess the integrity of schedules they review. Wouldn’t it be great to have your schedule optimized to their criteria for schedule review?
Watch a demonstration of basic use of the Diagnostic tab with different metrics
Pre-wash. Getting Your Timeline Ready for Diagnostics
Not to get too bogged down in statistics: try for green as best you can, and then set Cleanser to work. If you must have hard-constraints, make sure to check the option to maintain them before you Cleanse.
The point of all this due-diligence, or the pay-off, is that as the project progresses, you’ll find it easier to avoid, or correct out-of-sequence occurrences and you will be able to effect recovery measures and change orders with considerably less deconstruction. If you’ve done much compression and resequencing, than you understand how a cluttered schedule can scotch things up in a hurry. Indeed, a huge schedule invariably can’t get out of its own way, and may at some point become unserviceable.
Running the Characteristics tab shows that my basic schedule structure is pretty solid:
All phase and ribbon analyzers rely on Fuse’s metrics library, informed by industry standards – all built-in to the program’s knowledge base.
For my more complicated projects; such as heavy above-ceiling MEP, I sometimes push the limit on SS/FF relationships, and also in Merge Hotspots (high number of predecessors). When I am too far in the red, I can simply ratchet up the allowable relationships using the Tripwire Threshold, in the Metrics tab, to improve my Logic Density™ score. All metrics offer this option.
Tweaking the Tripwire Thresholds
Thresholds are clearly indicated, as are their respective formulae, under the Metrics tab. Take careful not to overwrite these formulae, as they represent the industry standard metrics that the software is defaulted to measure, as well as the industry values critical to the Benchmark tab assessments.
Cost & Resource Loading – Solid Relational Database for Full Project Control
We’ve already looked at the Schedule Quality, DCMA-14, and Characteristics analyzers. It is time to introduce the others.
Cost, Earned Value, Earned Value Book, and Earned Schedule, appear to be solid cost tracking tools; however, their application is not part of my review.
Work/Resources is a resource-loading tool tied to the cost-tracking modules. Their application is not part of my review.
The rest of the metric tabs drill down into reports on total-float, status, lags, etc., but the standout: Scenario Comparison, which compares 10 metrics into a bottom line, or score, is a choice graphic for even your most confused clients.
Baseline vs. UD8 Scenario Comparison
The only concern with this timeline is the critical path; at 39%, this project, if delayed, has way too many activities that could go wrong. The other metric to notice is the Float Ratio ™. The Scenario Comparison drop-down help defines float ratio as the “average float divided by remaining duration. A useful metric for determining how much float relative to the amount of work within an activity. The higher the ratio, the more float per day of activity duration. Includes only normal activities that are planned or in progress.”
Of course, Cleanser can only do so much, and its analyzers merely inform. You still have to take action: go back in and act on the recommendations. After you do, you can import the schedule back into Fuse for analysis. Even better, use Fuse to facilitate your monthly update reports.
Next post will explore the Logic module, where you can view a project’s entire relationship profile at a glance, or drill down into each type.
For the previous post on Acumen Fuse, click here
You may download a nearly full-function trial version from Acumen’s download page here. This optional convenience is offered as a limited arrangement with Acumen, for this series.


